 This is the part of year to look forward to some time with family and friends, relax (we hope you can do so!) and look at the fading year 2017. And it is the time to wish you, our clients, our business partners and many more contacts a successful and prosperous New Year 2018! Developing special areas with new customers worldwide For Inolytix the year 2017 has brought a substantially broader customer base and exciting developments in surface characterisations, for example:
Open collaboration with science-based approach A positive support, a science-based approach and the thrive for improvements is at the heart of our business, now completing its fourth year, e.g.
Whatever the year 2018 brings to you – we wish you confidence, enthusiasm and a portion of luck, too.
0 Comments
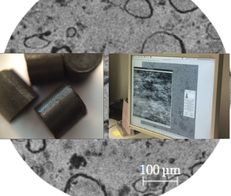 Ever wondered how your material looks inside?
New analytical methods like Microtomography (XMT) are able to generate image data we did not have before: huge amounts of data. In our case 2048 images per sample. Based on synchrotron based X-ray radiation and the computing power of today the sample is analysed in a few minutes or even seconds - with voxel sizes down to 325 nm and quantifiable image analysis. Academic high-tech? Not at all! Industry is encouraged to use the facilities and Inolytix helps you to interact smoothly with researchers. Discover your own products, see what normally stays hidden! The Case Study of heterogeneous catalyst pellets Combination of Methods: 3D-characterization + Microtomography Conventional analysis: Scanning electron microscopy of one (1) image after sample preparation. The Inolytix way: Synchrotron-based X-ray Microtomography with 2048 image slices in 4 minutes without any sample preparation. 3D-image analysis for structural quantification. Are catalyst pellets homogenous? Do the pelletising process and any treatments deliver uniform morphologies? Are there heterogenities or irregularities? These were the underlying questions of a recent study of catalyst pellets we performed. Without any sample preparation, the 3D-characterization of catalysts pellets was possible with synchrotron based X-ray microtomography. Thanks to the additional quantitative image analysis of thousands of images, we could reveal that the catalyst pellets examined had heterogeneous inner structures with distinct differences. Surprisingly, the structural differences were clearly visibly at a scale above 300 nm, i.e. well beyond the scale of micro- and mesopores. Hidden aspects became visible - with new insights for our customer! Find the appropriate analytics for your case Inolytix is your expert to pick and choose the methods that make the most sense for your needs. We draw upon our +20 years of R&D experience to add a 360 degree interpretation of your results. Your Partner for the entire cycle from experiment design to measurement to analysis and interpretation. Contact us for a free consultation call for your specific request. IGC explained by Prof. Steven AbbottAt the IGC Symposium in June 2016 Prof. Steven Abbott already presented his app for IGC. Now he produced a series of videos and explains the method and the details of IGC and the IGC measurements. Use this great opportunity and learn more about IGC at your desk. Start with the basics and then discover the details in these 4 videos (5 - 7 min each). IGC - The BasicsIGC - Surface MeasurementsMeasuring polymer diffusion coefficients via IGCUsing IGC to measure Hansen Solubility ParametersYou find more details on Steven Abbotts website.
We would love to hear your comments or questions on this. Please share them in the comments below. 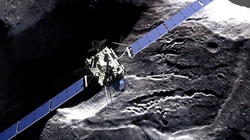 Careful preparation to see the unknown!
After 10 years of flight Rosetta reached Comet 67P/Churyumov-Gerasimenko. Great pictures of the unknown reached us and more are following including analysis of the material itself. What effort, precision and time has been spent to obtain this unique insights! (Note: original and best picture by ESA (link) has restrictions, shown is a simulation (link). Do we know our surfaces? When I saw the original wonderful picture of the comet I had a strange association: we are amazed to see the surface of this comet out in space but we are reluctant that here on earth many surfaces in chemical applications remain rather unknown. One example: new soil release polymers are developed to enhance the removal of stains during washing. Yes, chemically the composition of these new molecules is known. Yes, it is also tested how well stains are removed. Is this enough to guide the researchers for really innovative products? The value of better insights How would it be if the researcher would know if and how these new soil release polymers adsorb on the fibres? Is there a monolayer? Is the distribution uniform? Does it penetrate into the thread or not? How is the cause and effect of modifications? And there are many more examples: dispersing agents on pigments and fillers, corrosion inhibitors, cleaning agents, flotation in mining and so on... Surface analysis is possible! I know, analysis of the surface is not easy and sometimes maybe even a waste of time (and money). But compared to Rosetta’s mission, todays surface analysis is much more easy – and probably much easier than you think. For example 2D images of chemical composition of the first few nm of surfaces can be obtained by advanced time-of-flight secondary ion mass spectroscopy (ToF-SIMS). The scanning mode provides lateral resolutions up to 200 nm! And depth profiles might be taken, too. X-ray photoelectron spectroscopy (XPS), also known as ESCA (electron spectroscopy for chemical analysis) is best suited for quantitative results. And there are more tools available... Overcome trial and error It is my passion to find the best tools for surface analysis and facilitate real understanding - to supplement application tests and overcome trial and error. And sometimes even a smart, colored SEM picture explains just what you want say to your customer or your management. Enjoy Rosetta’s mission and your own insights! |


 RSS Feed
|
We are eager to support you.
|